Slurm jobs are stuck in pending, despite GPUs being idle

Hi there,

I’m running into an issue in the endeavour cluster in the ISI partition.

When I check sinfo -p isi, I can clearly see idle GPUs in the partition:

PARTITION AVAIL  TIMELIMIT  NODES  STATE NODELIST
isi          up 14-00:00:0      4    mix a11-[01-03],d23-01
isi          up 14-00:00:0     12   idle d14-[01-02],d23-[02-06],e09-[13-17]

But when I try to explicitly request one of the idle GPUs, I get stuck at pending for a long time:

[jh_445@endeavour1 ~]$ salloc --partition=isi --gres=gpu:k80:1 --time=4:00:00 --ntasks=1 --cpus-per-task=2 --mem=32GB
salloc: Pending job allocation 8865988
salloc: job 8865988 queued and waiting for resources

Trying out squeue -p isi --start -u jh_445 also doesn’t provide a good sense of when the GPU becomes available:

JOBID    USER      ACCOUNT   PARTITION QOS       NAME                                ST TIME       TIME_LIMIT NODES CPU S:C:T NODELIST(REASON)
8795625  jh_445    jonmay_23 isi       normal    xfmr-zh-en-4gpu-1-1-shuf            PD 0:00       5-00:00:00 1     1   *:*:* (Resources)
8795626  jh_445    jonmay_23 isi       normal    xfmr-zh-en-4gpu-0-1-shuf            PD 0:00       5-00:00:00 1     1   *:*:* (Priority)
8865988  jh_445    jonmay_23 isi       normal    interactive                         PD 0:00       4:00:00    1     2   *:*:* (Priority)

I know there has been a lot of related posts on this issue (e.g. here and here), and I really don’t think it’s because of the inherent nature of the fairshare algorithm (unless this algorithm withholds GPUs from lower-priority users, even if no one else is using them?). I can’t see anyone else in the partition requesting or using the idle GPUs, and I get stuck in the pending state even after loosening the restriction and asking for any generic node. This has been a recurring problem with several people I know, and I’ve never encountered this issue before in previous high-powered computing clusters. I would really appreciate if you guys would mind taking a closer look.

Thanks!

cc @jonmay
2 Likes

Hi,

When you run squeue -u $USER you can see a “Reason” your job is pending and the current is “Resources” or “Priority”. Resources means there aren’t compute resources currently available for your job to start right now. Priority means that there are other jobs with higher priority than yours that are waiting on resources.

For example, you job 8865998 requests gres:gpu:4. The only compute node that can satisfy the request of 4 gpus per node are currently in use. So, while it is correct that there are idle resources, Slurm is not starting your jobs because they request resources that are not available.

If you are able to relax this request to gres:gpu:2 Slurm will be able to schedule your jobs on the idle compute nodes.

In regards to the --start option, it is unfortunately known to not provide reliable start times for jobs. Let me know if you have any further questions.

Best,
Cesar

My job requests only

#SBATCH --partition=gpu
#SBATCH --gres=gpu:1
#SBATCH --time=01:00:00
#SBATCH --mem=16G
#SBATCH --nodes=1
#SBATCH --ntasks=1
#SBATCH --cpus-per-task=1

when there are idle gpus.

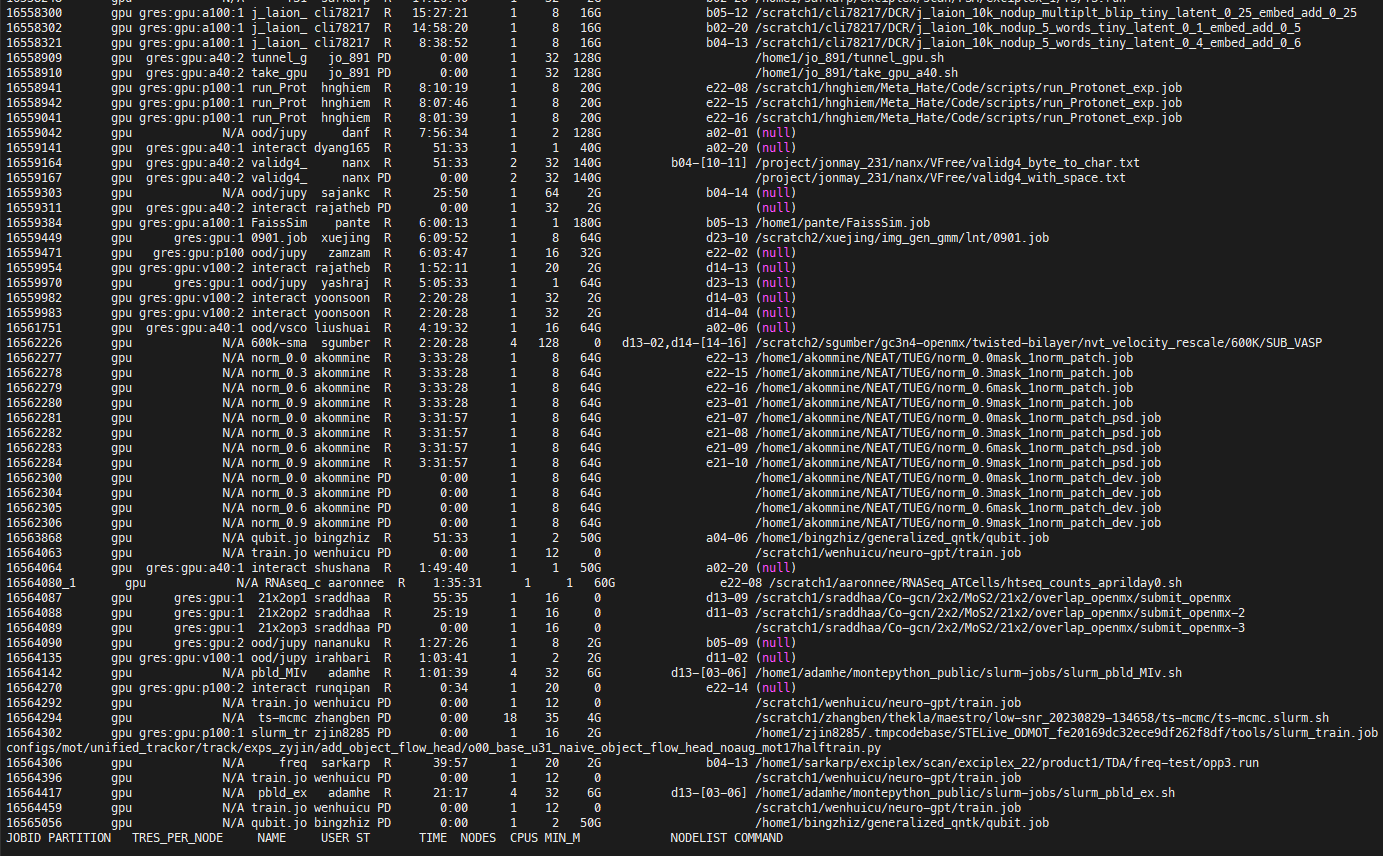
gpu          up 2-00:00:00     29   idle b11-10,d13-[04-08],d14-[14-17],d23-14,e21-[03-04,08,16],e22-[01-14]

And yet my jobs can stay in pending status for hours

             JOBID PARTITION     NAME     USER ST       TIME  NODES NODELIST(REASON)
          16454466       gpu  digress haomingl PD       0:00      1 (Priority)
          16454465       gpu  digress haomingl PD       0:00      1 (Priority)

when the two jobs are my only jobs in the queue.

I am also a user of CARC, and I have faced with the horrible GPU allocation problem over past few months. Although the problem is still NOT solved get, but I can share some information with you.

  1. Ticket through carc-support@usc.edu will be replied around 3-5 days. But a post on forum, it might take weeks.

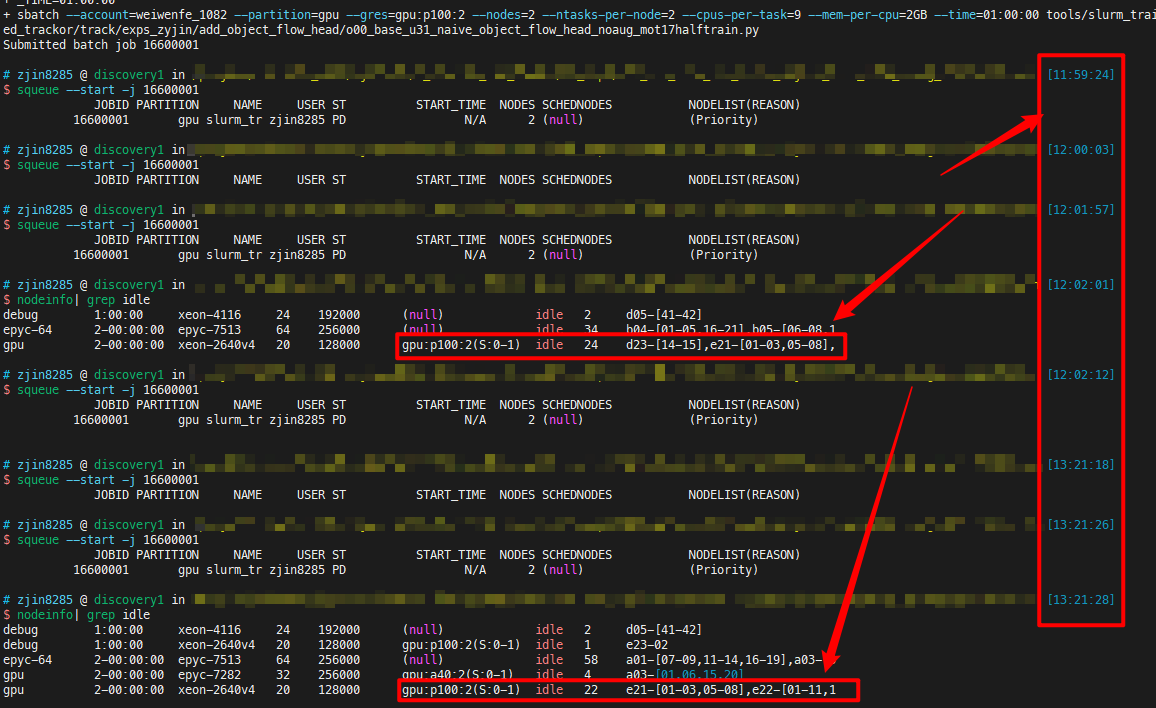
  2. After you submit your job, you can use the following command to check the potential start time. squeue --start -j 16564302. Here you need to use your own JobID, and the output looks like this.

         JOBID PARTITION     NAME     USER ST          START_TIME  NODES SCHEDNODES           NODELIST(REASON)
      16564302       gpu slurm_tr zjin8285 PD 2023-09-02T00:49:55      1 e22-07               (Priority)
  1. The starting time actually has a possibility to increase from time to time, even if you have already submitted your job several hours ago. According to the CARC supporters and my observation, here are two possible reasons,
  • Some nodes might go down.
  • If you are requesting 4 or 8 GPUs, then other job behind you with only 1 or 2 GPUs might get allocated first.
  1. You could also see a term called NodeList(Reason). If it shows Resources, it means there are not enough idle GPUs. If it shows Priority, it means you are delayed because there are some other jobs with higher priority before you.

  2. About the reason why there are enough idle GPUs but your job can still not get allocated, according to my observation and CARC supporters, there are two reasons,

  • Your job requires a long time, for example 40 hours.
  • Most of the jobs on Discovery use only 1 GPU. So if you want to request 4 GPUs, it will be much better to request 4 nodes with 1 GPU each, rather than 2 nodes with 2 GPUs each.
  • Some other jobs have already used all of the CPUs and Memory on that node, but they only request 1 GPU or 0 GPU.
  1. I asked them to add one rule into the system two weeks ago, but there is no response. The rule says that
  • When you are requesting 2 GPUs for one node, you can use all CPUs and Memories.
  • But when you are requesting 1 GPU for one node, you can only use up to half of the CPUs and half of the Memories.
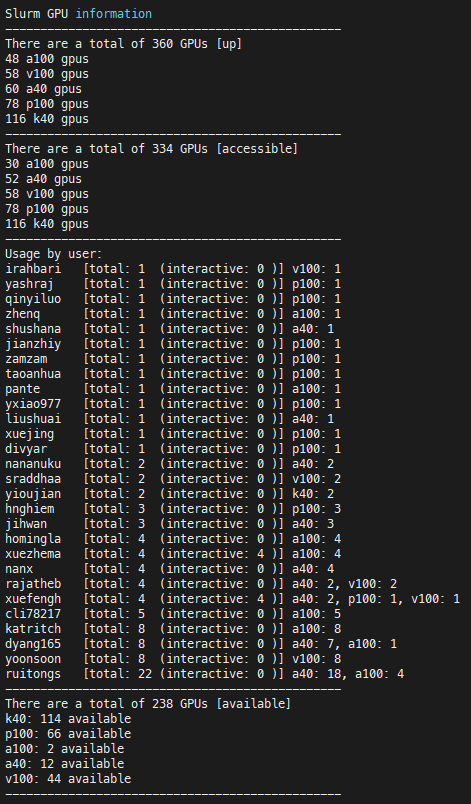
  1. You can use following command to see how many GPUs are available, although the number is not accurate due to previous reasons.

gpuinfo

  1. You could also use the following command to check the queue. So if you find someone has already submitted 100 jobs on A100, perhaps it might not be a good idea to submit your job on A100 then.

squeue -o"%i %.9P %.15b %.8j %.8u %.2t %.10M %.6D %.5C %.5m %.20N %o" --partition=gpu| sort -k 1

I did both. Haven’t heard anything back from the support ticket. Will probably go to their OH.

When my jobs are stuck in the way I described, squeue --start -j returns “N/A” for start times.

Like in the slurm script I had provided, my jobs require a single, non-model-specific gpu, with minimal cpu, memory, and run time requirements. I’m quite sure the resources requested are available at the time I submit the jobs. Nonetheless, I thank you for your comment. I’m glad to know that I’m not alone in this issue.

Yes, I have also faced with the problem you described. There are 24 idle nodes for P100, but my job still waits for hours, and the start time is always N/A.

I’ve encountered this problem as well, and I did some digging. I discovered that at least one node in the cluster (a11-02) has GPUs that Slurm lists as allocated but are not part of any job:

$ gpuinfo -p isi | grep -P '^\d+ a40 gpus' | head -1
24 a40 gpus
$ gpuinfo -p isi | grep -P '^a40: \d+ available'
a40: 13 available
$ cqueue -p isi | grep a11 | cut -f 1 -d ' ' | xargs -I % bash -c "scontrol show job -d % | grep ' GRES'" | sort
     Nodes=a11-01 CPU_IDs=0-7 Mem=131072 GRES=gpu:a40:1(IDX:2)
     Nodes=a11-02 CPU_IDs=0 Mem=131072 GRES=gpu:a40:1(IDX:2)
     Nodes=a11-02 CPU_IDs=1-3,12-16 Mem=131072 GRES=gpu:a40:1(IDX:3)
     Nodes=a11-03 CPU_IDs=0-1,32-33 Mem=32768 GRES=gpu:a40:8(IDX:0-7)
$ scontrol show node a11-02 | grep AllocTRES
   AllocTRES=cpu=9,mem=256G,gres/gpu=4,gres/gpu:a40=4
$ date
Tue Sep  5 20:55:24 PDT 2023

As one can see, gpuinfo reports that 11 A40 GPUs are available in the isi partition. From looking at running jobs, one can see that 2 GPUs are being used by jobs on a11-02, but the node has 4 GPUs allocated as Slurm resources. This very much does not seem like correct behavior.

Although there are jobs in the queue right now, I noticed this same problem when the queue was empty, so I don’t believe this is related to any reservation of GPUs as part of scheduling.

Here are the updates from CARC supporters on my problem.

  1. If you submitted huge amount number of jobs recently, then perhaps your next job will be delayed. That is exactly the case I faced with in the previous reply, because I keep launching debug jobs, even though all of my jobs are less than 5 minutes.

  2. The fairness determination (who should have more resources and who should have less) has already been implemented deep inside the code of Slurm. And CARC supporters do not have the plan to modify those codes.

  3. Their suggestion would just be that

  • Lowering the GPUs, CPUs, Memories, and requested running time of the job.
  • Do not specify the GPU type, and let Slurm try to allocate all types of GPUs for the job, including P100, V100, A40, and A100. But that is not useful for my case, because I need 4 GPUs for one job. If different types of GPUs are allocated for the same job, faster GPUs will always wait for the slower ones. However, if you only need 1 GPU per job, then this suggestion makes sense.
  • If you have another account, switch to another one would help.

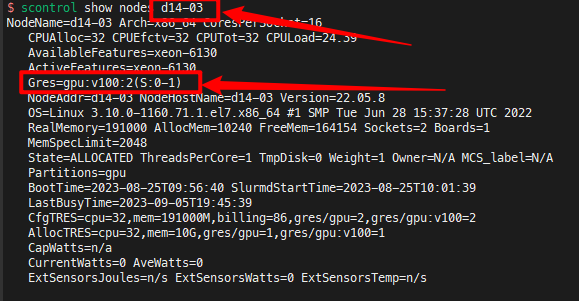
About the GPU allocation, I also had some findings.

  1. Some users submitted jobs without GPU. Unfortunately, those jobs will still be allocated on GPU nodes. That is also one of the reasons why jobs cannot get allocated even though GPU is idle.

image

Hi all,

I’d like to contribute to the ongoing discussion. I have seen a handful of times when there was a problem with the Slurm scheduler but in the vast majority of cases, jobs are in the pending state due to availability of resources or lower priority. If a job is pending and the desired resources are idle, it’s normally because the scheduler is planning on using them soon.

Slurm will “squeeze” in a job on those resources if it can complete before they will be needed. You may hear this referred to as “backfilling”. ZhangyuJin has provided some strategies to increase the likelihood of triggering a backfill.

Overall I recommend that you submit your job and wait patiently. Looking at some of the job IDs referenced, it seems like they started an hour or two after they were submitted, which isn’t too bad.

If you would like to check your priority, you can use the sshare command. For example, sshare -u csul | grep csul

$ sshare | head -n 1; sshare -u csul | grep csul
Account                    User  RawShares  NormShares    RawUsage  EffectvUsage  FairShare 
csul_1063                csul          1    0.008850           0      0.000000   1.000000 
dtran642_927             csul          1    0.090909           0      0.000000   0.237342 
hpcroot                  csul          1    0.076923         465      0.101645   0.585116 
hpcsuppt_613             csul          1    0.006536           0      0.000000   0.436709 
osinski_703              csul          1    0.035714           0      0.000000   1.000000 
renney_710               csul          1    0.008403           0      0.000000   0.620035 
rhie_130                 csul          1    0.041667           0      0.000000   0.215299 
wjendrze_120             csul          1    0.041667           0      0.000000   0.404190 

The Fairshare column represents your priority. Anything below 0.5 is considered “over” usage and above is considered “under” usage. You can read more about the algorithm here:
https://slurm.schedmd.com/classic_fair_share.html

Your fairshare score will replenish over time and is consumed based on the amount of resources you use. We are able to make adjustments to how quickly your score recovers and how much it is consumed when you use certain kinds of resources. During our last maintenance period we increased the replenishment rate.

There are cases when a user will occupy a node in the gpu partition and not use a gpu resource. I think in most cases it’s accidental. Some users forget/didn’t know they need to add gres=gpu:N. If we do notice (or it is brought to our attention) that someone is doing it intentionally, we can definitely talk with them.

Finally, we are working on building a better monitoring dashboard so we will have more insight into queue times, especially for gpu resources. That we will have a better idea of when queue times are abnormally high and can take action if required.

Here is our current one: Slurm Dashboard

If there are any unaddressed concerns please let me know.

-Cesar

2 Likes

This is helpful, thank you! A follow-up question: does this algorithm (or the calculation of usage in general) look at the amount of resources requested or actually used? For example, if I request a node for 1 day but the program only runs for 1 min, by how much does my usage increase?

The resources consumed is used in the calculation, not resources requested.